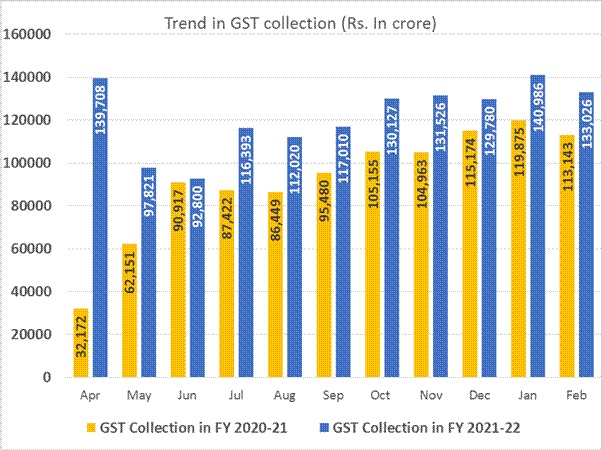
he gross GST revenue collected in the month of February 2022 is Rs 1,33,026 crore of which CGST is Rs 24,435 crore, SGST is Rs 30,779 crore, IGST is Rs 67,471crore (including Rs 33,837 crore collected on import of goods) and cess is Rs 10,340 crore (including Rs 638 crore collected on import of goods).
The government has settled Rs 26,347 crore to CGST and Rs 21,909 crore to SGST from IGST. The total revenue of Centre and the States in the month of February 2022 after regular settlement is Rs 50,782 crore for CGST and Rs 52,688 crore for the SGST.
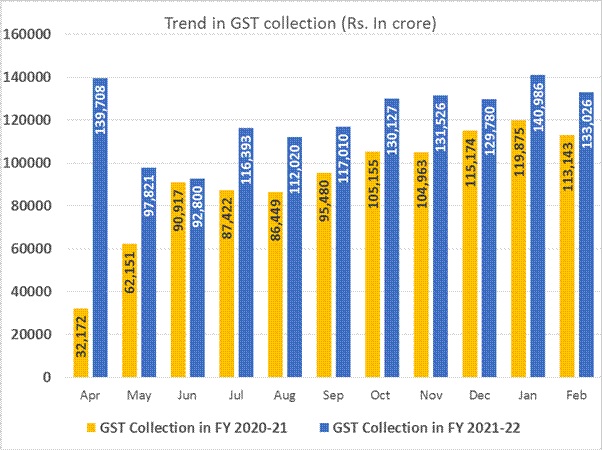
The revenues for the month of February 2022 are 18% higher than the GST revenues in the same month last year and 26% higher than the GST revenues in February 2020. During the month, revenues from import of goods was 38% higher and the revenues from domestic transaction (including import of services) are 12% higher than the revenues from these sources during the same month last year.
February, being a 28-day month, normally witnesses revenues lower than that in January. This high growth during February 2022 should also be seen in the context of partial lockdowns, weekend and night curfews and various restrictions that were put in place by various States due to the omicron wave, which peaked around 20th January.
This is for the fifth time GST collection has crossed Rs 1.30 lakh crore mark. Since implementation of GST, for the first time, GST cess collection crossed Rs 10,000 crore mark, which signifies recovery of certain key sectors, especially, automobile sales.
The chart below shows trends in monthly gross GST revenues during the current year. The table shows the state-wise figures of GST collected in each State during the month of February 2022 as compared to February 2021.
State-wise growth of GST Revenues during February 2022[1]
| State Name | Feb-21 | Feb-22 | Growth |
| Jammu and Kashmir | 330 | 326 | -1% |
| Himachal Pradesh | 663 | 657 | -1% |
| Punjab | 1,299 | 1,480 | 14% |
| Chandigarh | 149 | 178 | 20% |
| Uttarakhand | 1,181 | 1,176 | 0% |
| Haryana | 5,590 | 5,928 | 6% |
| Delhi | 3,727 | 3,922 | 5% |
| Rajasthan | 3,224 | 3,469 | 8% |
| Uttar Pradesh | 5,997 | 6,519 | 9% |
| Bihar | 1,128 | 1,206 | 7% |
| Sikkim | 222 | 222 | 0% |
| Arunachal Pradesh | 61 | 56 | -9% |
| Nagaland | 35 | 33 | -6% |
| Manipur | 32 | 39 | 20% |
| Mizoram | 21 | 24 | 15% |
| Tripura | 63 | 66 | 4% |
| Meghalaya | 147 | 201 | 37% |
| Assam | 946 | 1,008 | 7% |
| West Bengal | 4,335 | 4,414 | 2% |
| Jharkhand | 2,321 | 2,536 | 9% |
| Odisha | 3,341 | 4,101 | 23% |
| Chhattisgarh | 2,453 | 2,783 | 13% |
| Madhya Pradesh | 2,792 | 2,853 | 2% |
| Gujarat | 8,221 | 8,873 | 8% |
| Daman and Diu | 3 | 0 | -92% |
| Dadra and Nagar Haveli | 235 | 260 | 11% |
| Maharashtra | 16,104 | 19,423 | 21% |
| Karnataka | 7,581 | 9,176 | 21% |
| Goa | 344 | 364 | 6% |
| Lakshadweep | 0 | 1 | 74% |
| Kerala | 1,806 | 2,074 | 15% |
| Tamil Nadu | 7,008 | 7,393 | 5% |
| Puducherry | 158 | 178 | 13% |
| Andaman and Nicobar Islands | 23 | 22 | -5% |
| Telangana | 3,636 | 4,113 | 13% |
| Andhra Pradesh | 2,653 | 3,157 | 19% |
| Ladakh | 9 | 16 | 72% |
| Other Territory | 134 | 136 | 1% |
| Center Jurisdiction | 129 | 167 | 29% |
| Grand Total | 88,102 | 98,550 | 12% |
Does not include GST on import of goods
Source:PIB





 Finance