The gross GST revenue collected in the month of October 2022 is ₹ 1,51,718 crore of which CGST is ₹ 26,039 crore, SGST is ₹ 33,396 crore, IGST is ₹ 81,778 crore (including ₹ 37,297 crore collected on import of goods) and Cess is ₹ 10,505 crore (including ₹ 825 crore collected on import of goods), which is second highest till date.
The government has settled ₹ 37,626 crore to CGST and ₹ 32,883 crore to SGST from IGST as regular settlement. In addition, Centre has also settled Rs 22,000 crore on adhoc basis in the ratio of 50:50 between Centre and States. The total revenue of Centre and the States after regular as well as adhoc settlements in the month of October 2022 is ₹74,665 crore for CGST and ₹ 77,279 crore for the SGST.
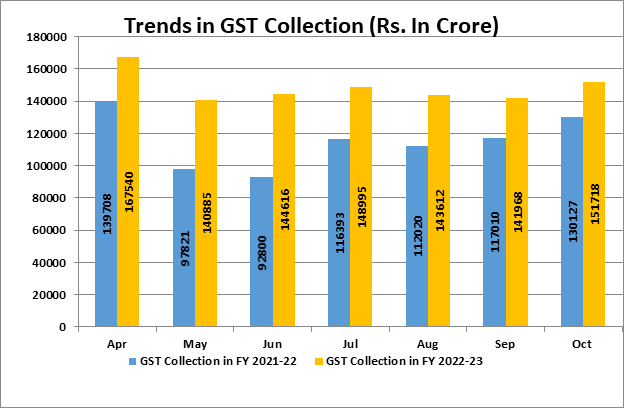
The revenue for October 2022 is second highest monthly collection, next only to the collection in April 2022 and it is for the second time the gross GST collection has crossed Rs. 1.50 lakh crore mark. October also saw the second highest collection from domestic transactions, next only to April 2022. This is the ninth month and for eight months in a row now, that the monthly GST revenues have been more than the ₹ 1.4 lakh crore mark. During the month of September 2022, 8.3 crore e-way bills were generated, which was significantly higher than 7.7 crore e-way bills generated in August 2022.
The chart below shows trends in monthly gross GST revenues during the current year. The table shows the state-wise figures of GST collected in each State during the month of October 2022 as compared to October 2021.
State-wise growth of GST Revenues during October 2022[1]
| State | Oct-21 | Oct-22 | Growth |
| Jammu and Kashmir | 648 | 425 | -34% |
| Himachal Pradesh | 689 | 784 | 14% |
| Punjab | 1,595 | 1,760 | 10% |
| Chandigarh | 158 | 203 | 28% |
| Uttarakhand | 1,259 | 1,613 | 28% |
| Haryana | 5,606 | 7,662 | 37% |
| Delhi | 4,045 | 4,670 | 15% |
| Rajasthan | 3,423 | 3,761 | 10% |
| Uttar Pradesh | 6,775 | 7,839 | 16% |
| Bihar | 1,351 | 1,344 | -1% |
| Sikkim | 257 | 265 | 3% |
| Arunachal Pradesh | 47 | 65 | 39% |
| Nagaland | 38 | 43 | 13% |
| Manipur | 64 | 50 | -23% |
| Mizoram | 32 | 24 | -23% |
| Tripura | 67 | 76 | 14% |
| Meghalaya | 140 | 164 | 17% |
| Assam | 1,425 | 1,244 | -13% |
| West Bengal | 4,259 | 5,367 | 26% |
| Jharkhand | 2,370 | 2,500 | 5% |
| Odisha | 3,593 | 3,769 | 5% |
| Chhattisgarh | 2,392 | 2,328 | -3% |
| Madhya Pradesh | 2,666 | 2,920 | 10% |
| Gujarat | 8,497 | 9,469 | 11% |
| Daman and Diu | 0 | 0 | 20% |
| Dadra and Nagar Haveli | 269 | 279 | 4% |
| Maharashtra | 19,355 | 23,037 | 19% |
| Karnataka | 8,259 | 10,996 | 33% |
| Goa | 317 | 420 | 32% |
| Lakshadweep | 2 | 2 | 14% |
| Kerala | 1,932 | 2,485 | 29% |
| Tamil Nadu | 7,642 | 9,540 | 25% |
| Puducherry | 152 | 204 | 34% |
| Andaman and Nicobar Islands | 26 | 23 | -10% |
| Telangana | 3,854 | 4,284 | 11% |
| Andhra Pradesh | 2,879 | 3,579 | 24% |
| Ladakh | 19 | 33 | 74% |
| Other Territory | 137 | 227 | 66% |
| Center Jurisdiction | 189 | 140 | -26% |
| Grand Total | 96,430 | 1,13,596 | 18% |
Source:PIB


 Finance